Project Overview
Monitoring solar generation values on tiny standard screens can be incredibly difficult without glasses. This display was specifically designed to solve that problem, featuring large, ultra-bright indicators alongside a wide array of smart features. It connects seamlessly to Wi-Fi, hosts a local WebUI, and integrates directly with Home Assistant, Solar Assistant, or any MQTT broker on your local network.
Core ChipESP32 DevKit
Power12V / Max 300mA
Main Matrix8x32 LED Panel
Setup Screen128x128 OLED
Driven primarily by incoming network MQTT data packets, the hardware can also be configured to decode direct hardware metrics from Victron systems and JK Inverter BMS units via an optional conversion kit. The entire PCB layout was built using off-the-shelf components inside KiCad, ensuring the files remain open and easy for anyone to modify.
The enclosing chassis is fully 3D-printed via a large-format PLA printer. Composed of 5 independent interlocking components (Top Cover, Middle Frame, Bottom Cover, and 2 deployable rear feet), the enclosure effortlessly transitions from a flush wall mount to a stable desktop angle frame.
Digital Readout & LED Interface
The main segment configuration supports displaying rolling values from 0.0 up to 9999,0000 utilizing designated automated decimal positions and thousands-separator commas. Through the WebUI management panel, builders can toggle the layout between 4-digit or 5-digit modes utilizing two unique font styles (e.g., 9999 vs 9999,0).
The display dynamically alters visual cues based on metrics polarity: active positive power flows show as Blue Digits (+) while negative loads reveal as Red Digits (-).
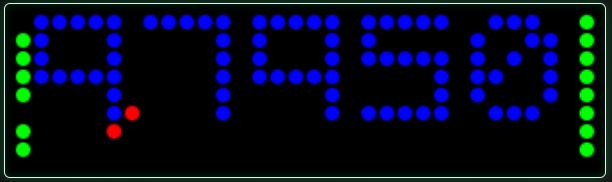
5-Digit Font Format Example
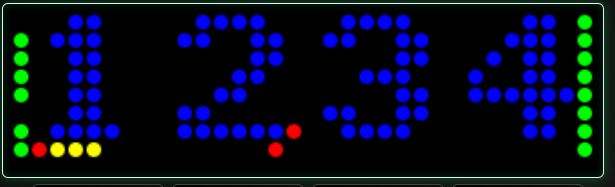
4-Digit Font Format Example
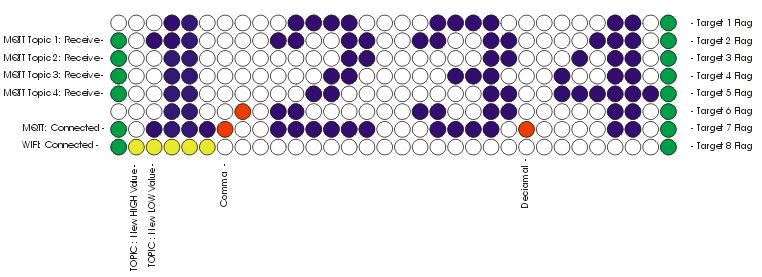
The numeric area cycles continuously through up to 4 user-selected MQTT topics at a configurable scanning speed. The row directly beneath the digits serves as a yellow status bar, highlighting exactly which topic index is being displayed over the physical hardware labels below it.
Additional hardware indicators on the perimeter handle vital communication states:
WebUI Dashboard Management
The onboard ESP32 serves an internal web browser dashboard broken down into four foundational components: System Setup, Topic Configuration, Target Triggers, and Live View.
1. System Setup
Configures primary connection variables including your local MQTT Broker Server Address and custom Network Hostname. Utilizing localized mDNS styling (e.g., Name.local), users can connect to the WebUI interface at any time regardless of dynamic IP address changes forced by local routers. This menu also adjusts absolute master matrix brightness scales, toggles standalone visual indicator groupings, and defines custom screen timeout intervals to preserve panel lifespan.
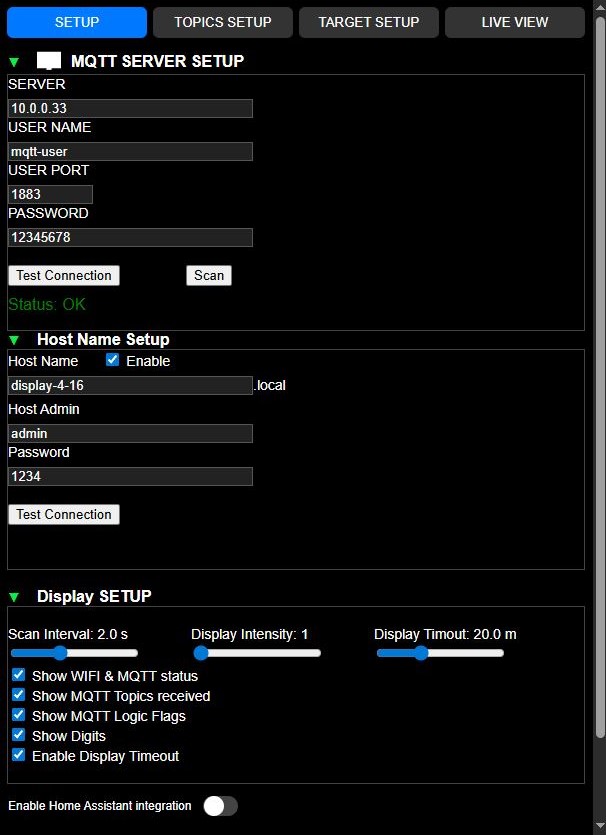
WebUI Global System Setup Interface
2. Topic Setup
Manages the 4 primary numeric scanning channels. The configuration interface features a smart drop-down selection menu that automatically parses and gathers raw root topics broadcasted over the current local network. Users can filter strings to narrow choices easily. The system retains the root designation alongside a counter of individual messages inside parentheses (). From there, you can define individual data types, attach human-readable nicknames, choose font constraints, and assign automatic high/low tracking flags.
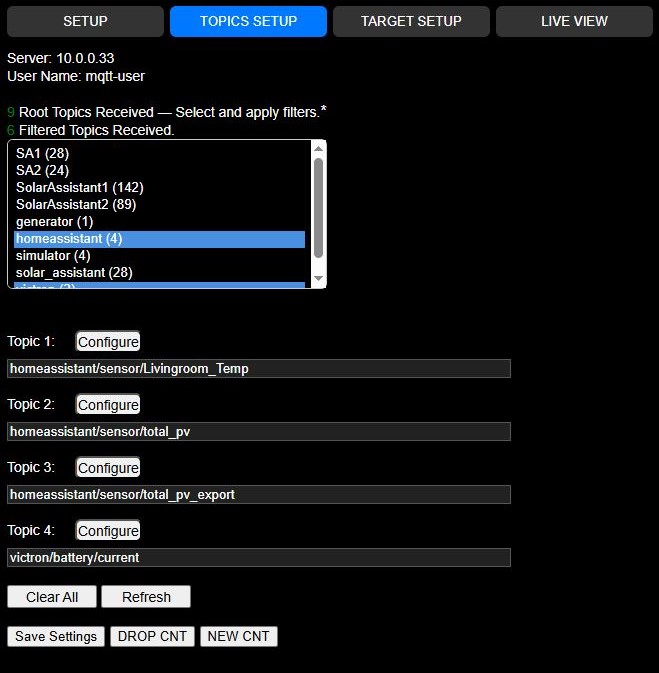
WebUI MQTT Topic Assignment and Data Filtering Options
3. Target Setup
Operates entirely independently of the numeric display segments. This section monitors secondary background topics strictly for limit tracking without interrupting the scanning cycle. Users apply conditional parameters such as Less Than (<), Greater Than (>), or Equal To (=) against targeted thresholds. For example, you can track overall array performance against physical data sheet specifications or bifacial expansion limits; surpassing factory thresholds logs the occurrence directly into the internal ESP32 non-volatile memory and shifts the matching right-side LED indicator from green to red. Flags can be easily reset through the web dashboard.
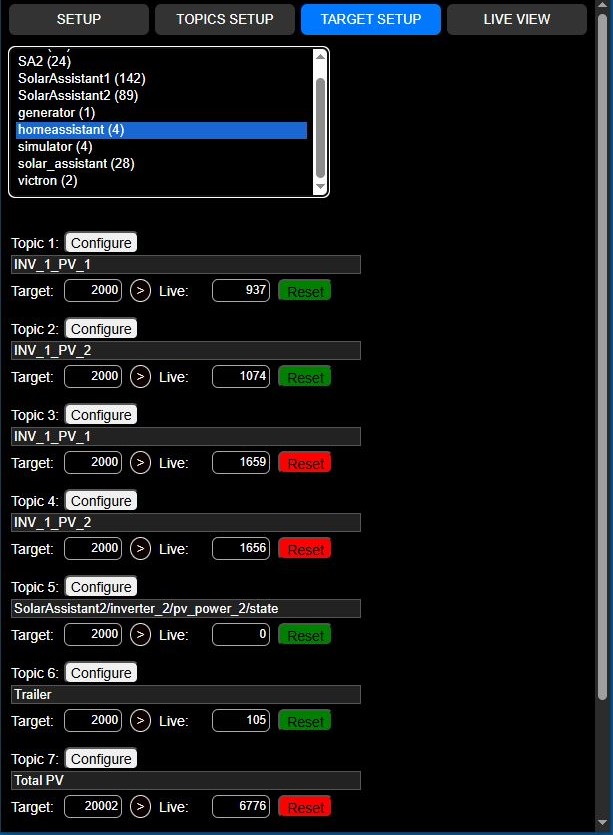
WebUI Target Setup and Limit Rules Configuration
4. Live View Terminal
Provides a real-time layout mirroring your physical hardware panel updates every 3 seconds. It features full remote overrides allowing users to clear system status alerts, view clean nicknames for poorly named server topics, or manage rolling cycles via hardware Play, Next, and Speed adjustment controls. Pausing the system on a singular topic locks the view to that topic, causing the bottom yellow row to flash to signify a manual hold state.
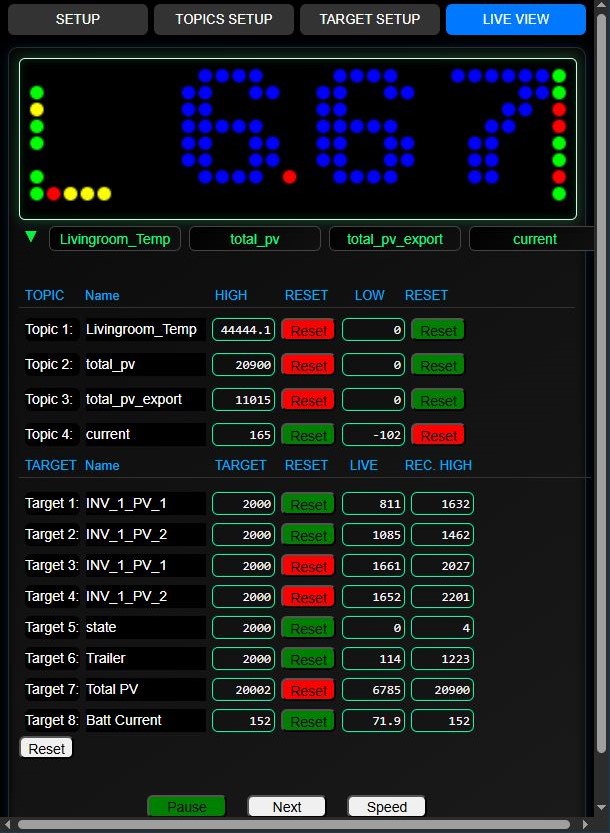
WebUI Live View Synchronization Interface Dashboard